Data
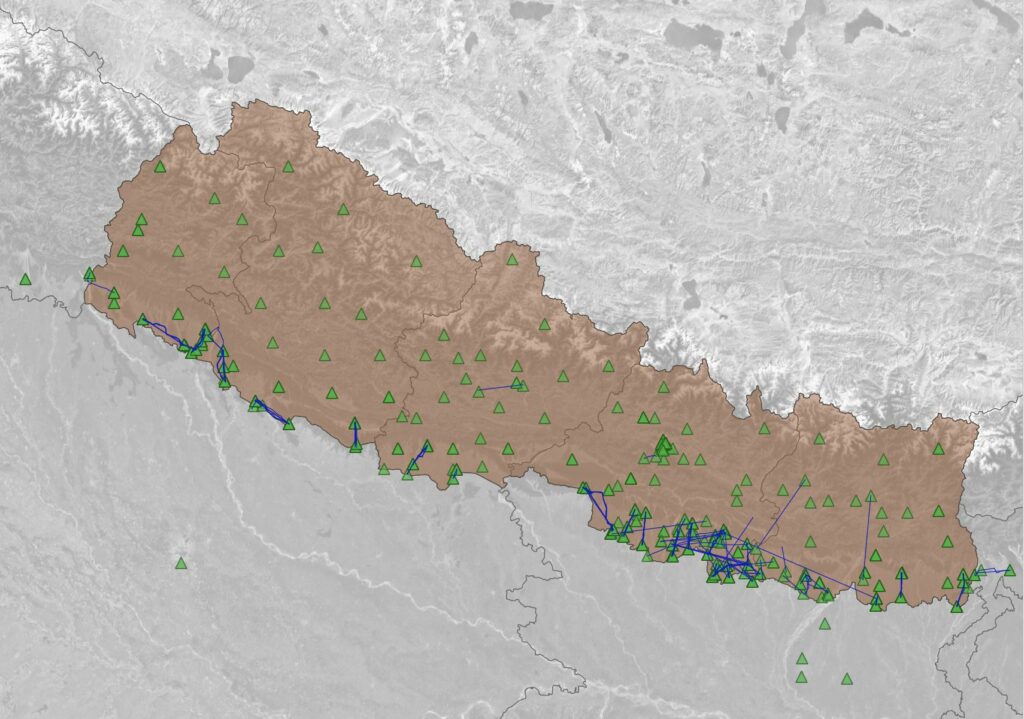
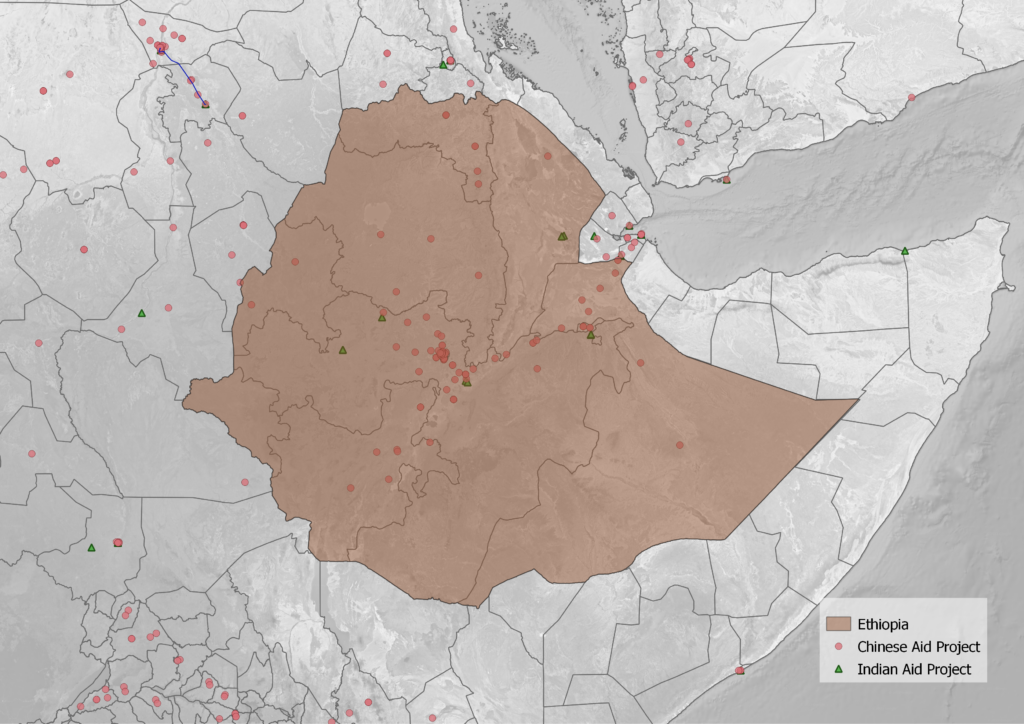
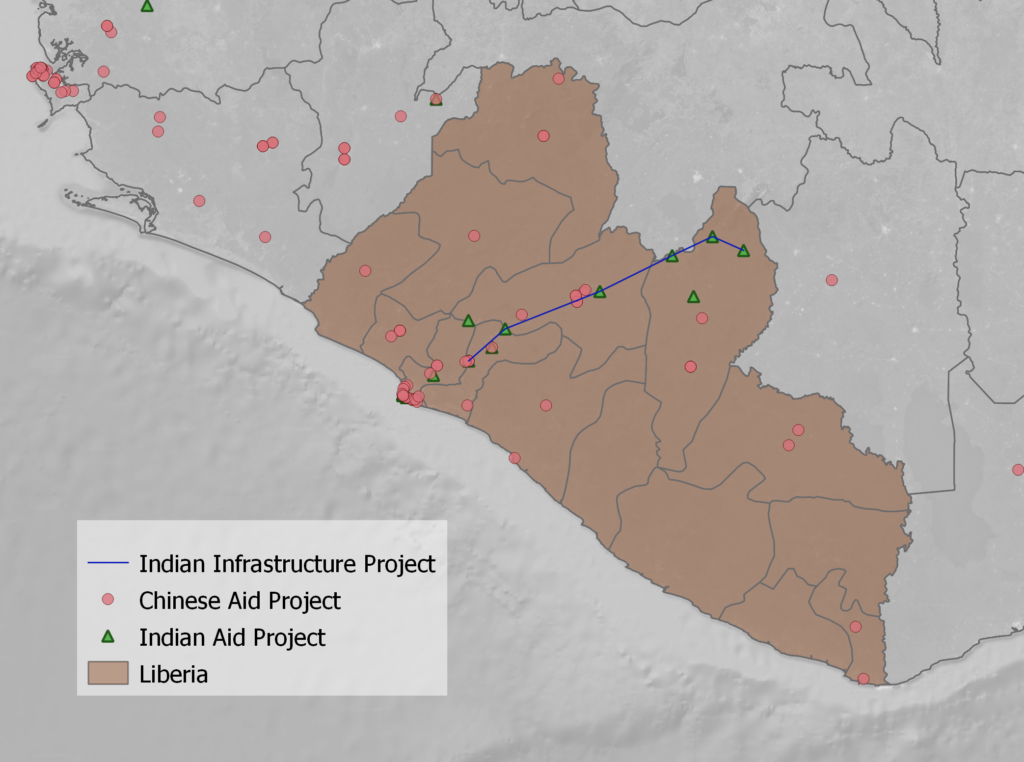
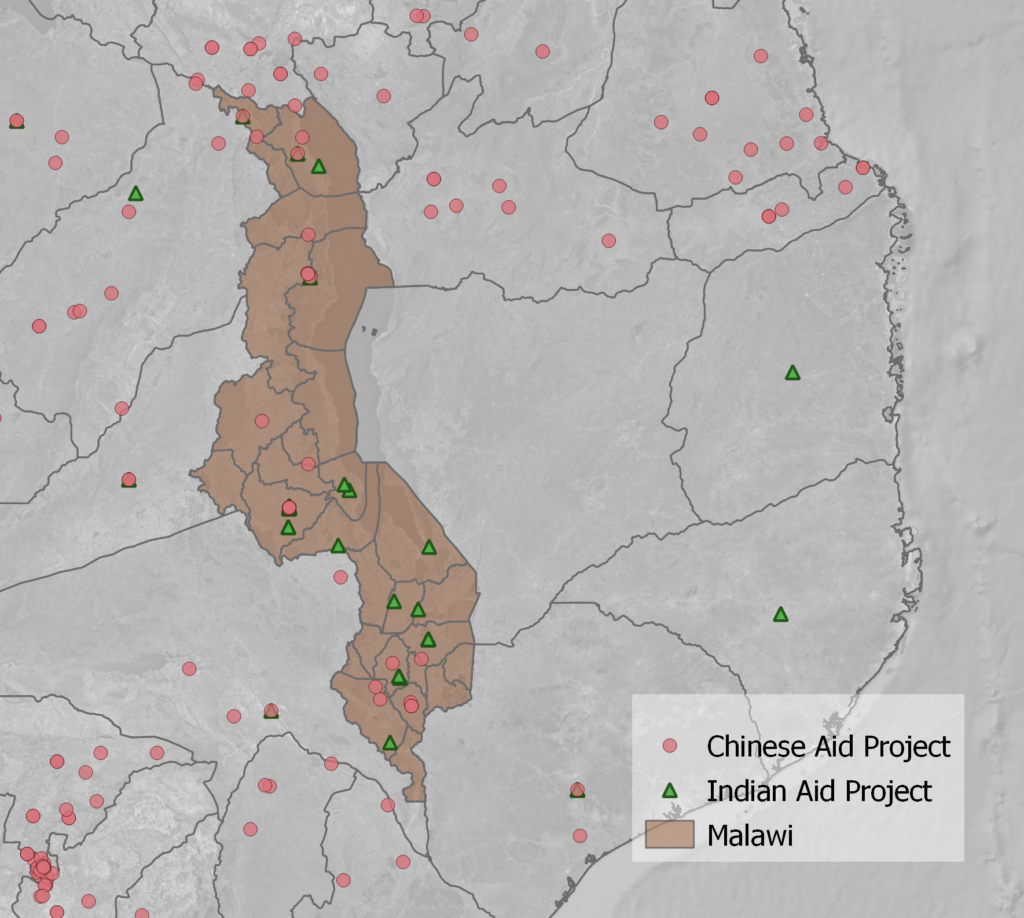
The Indian Development Finance Dataset contains all Indian development cooperation projects reported in official documents of India’s Ministry of External Affairs (MEA) and the Export-Import Bank of India (Exim) between 2007 and 2014. The project locations are geocoded with various levels of precision. We release the data in four different datasets at different levels of aggregation and detail. The do-file shows how these datasets related to each other. The codebook provides an overview of the data, the coding methodology, and the variables.
Citation
When using either dataset, please cite as:
Asmus, G., Eichenauer, V.Z., Fuchs, A., and Parks, B. (2021).
Does India Use Development Finance to Compete with China? A Subnational Analysis.
AidData Working Paper #110. Williamsburg, VA: AidData at William & Mary.
The Stata file “ind_aid_global_adm1regions_releaseV1.dta” was used by the authors in “Does India Use Development Finance to Compete with China? A Subnational Analysis” (AidData Working Paper #110, September 2021). Note that we use agencyname and not the flowclass variable to distinguish official Indian flows.
Project locations: Full project-location level dataset. Precision codes provide geographic granularity information as described in the Codebook.
ind_aid_global_locations_releaseV1.dta
ind_aid_global_locations_releaseV1.xlsx
Aggregation at second administrative unit level. For project-locations at precision level 3 or lower.
ind_aid_global_adm2regions_releaseV1.dta
ind_aid_global_adm2regions_releaseV1.xlsx
First administrative unit aggregates. For project-locations at precision level 4 or lower.
ind_aid_global_adm1regions_releaseV1.dta
ind_aid_global_adm1regions_releaseV1.xlsx
Country level aggregates.
ind_aid_global_country_releaseV1.dta
ind_aid_global_country_releaseV1.xlsx
Additional information: Project titles and long descriptions as provided by the respective funding agencies.
ind_aid_global_longdescription.dta
ind_aid_global_longdescription.xlsx